Introduction
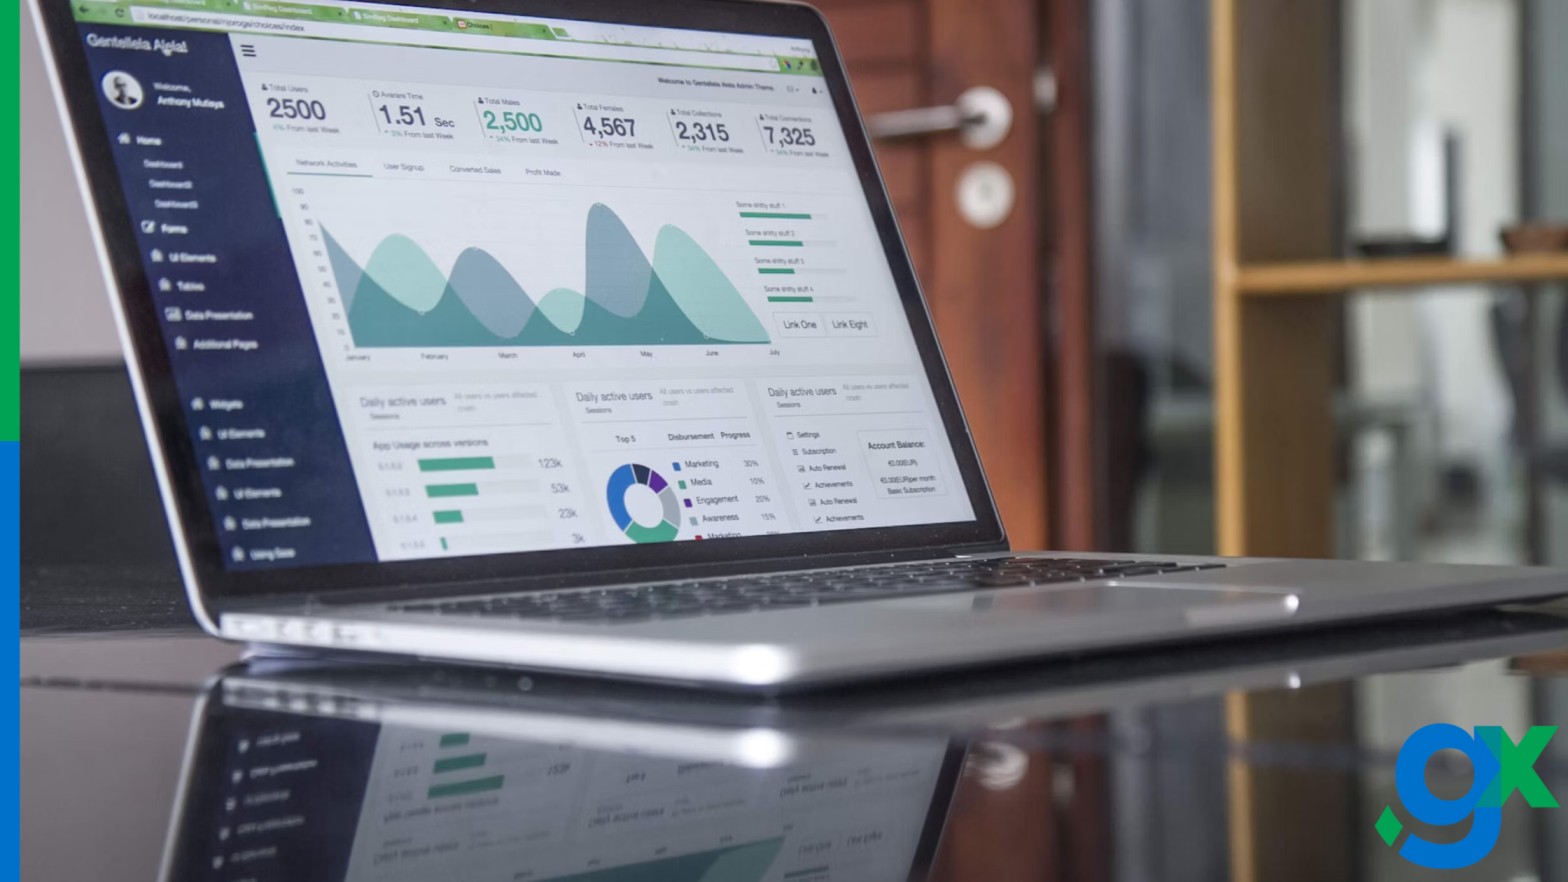
In today’s data-driven world, the ability to effectively visualize financial data has become increasingly important. This article explores the role of data visualization software in presenting financial insights, providing an overview of visualizing financial data and highlighting the benefits of using data visualization tools.
Importance of Visualizing Financial Data
A. Overview of the challenges in understanding complex financial data
Financial data can be complex and overwhelming, making it difficult to derive meaningful insights and identify trends or patterns.
B. Explanation of how data visualization aids comprehension and analysis
Data visualization simplifies complex financial information by presenting it in visual formats such as charts, graphs, and interactive dashboards. It allows for better comprehension, analysis, and identification of actionable insights.
C. Benefits of visualizing financial data for decision-making and strategy development
Visualizing financial data enables decision-makers to quickly grasp the big picture, identify trends, and make informed decisions. It supports strategy development by providing a clear understanding of financial performance, market trends, and customer behavior.
Understanding Data Visualization Software
A. Definition of data visualization software
Data visualization software refers to specialized tools that transform raw financial data into visually appealing and interactive visualizations. These tools offer a range of features to explore, analyze, and present data effectively.
B. Overview of popular data visualization software tools available in the market
Highlight well-known data visualization software tools such as Tableau, Power BI, and QlikView, which provide powerful capabilities for financial data visualization.
C. Key features and capabilities of data visualization software for financial data analysis
Discuss features like drag-and-drop functionality, customizable visualizations, data filtering, and interactive elements that enable users to delve into financial data, discover insights, and communicate findings effectively.
Steps for Effective Financial Data Visualization
A. Identifying the objectives and audience for visualization
Clearly define the purpose of the visualization and identify the target audience to tailor the visualizations accordingly.
B. Choosing the most appropriate visual representation for the data
Select the appropriate chart types (e.g., line graphs, bar charts, heatmaps) that best represent the specific financial data and insights being conveyed.
C. Determining the right data variables to include in the visualization
Carefully select the relevant variables and metrics to include in the visualization, ensuring they align with the objectives and provide meaningful insights.
D. Selecting appropriate color schemes and design principles
Use appropriate color schemes and design principles to enhance the readability, clarity, and aesthetic appeal of the visualizations.
E. Emphasizing clarity and simplicity in the visualization
Simplify the visualizations by removing unnecessary clutter and focusing on conveying the key messages and insights clearly.
F. Incorporating interactivity and dynamic elements for better insights
Utilize interactive elements, drill-down functionality, and dynamic filters to allow users to explore the data and gain deeper insights.
Examples of Financial Data Visualizations
A. Showcase of different types of visualizations commonly used in the finance
Highlight examples of visualizations such as trend analysis, comparative analysis, geographic mapping, and financial dashboards to demonstrate their effectiveness in conveying financial insights.
B. Case studies highlighting the successful use of data visualization software in financial analysis
Present real-world examples where organizations have utilized data visualization software to gain valuable insights, make informed decisions, and drive business growth.
C. Demonstration of how data visualization software can present complex financial data in digestible formats
Provide before-and-after examples to illustrate how data visualization software simplifies complex financial data, making it easier to understand and analyze.
Best Practices and Tips for Using Data Visualization Software
A. Using accurate and reliable data sources
Ensure data accuracy and reliability by sourcing data from trusted and verified sources.
B. Regularly updating and maintaining data visualizations
Keep visualizations up to date with the latest data to provide users with real-time insights.
C. Ensuring data security and privacy
Follow best practices for data security and privacy to protect sensitive financial information.
D. Collaborating and sharing visualizations with team members
Facilitate collaboration by allowing team members to access, share, and collaborate on visualizations for effective decision-making.
E. Seeking feedback and continuously improving visualizations
Encourage feedback from users to refine and improve visualizations, ensuring they meet the needs of the audience.
F. Staying updated with the latest trends and advancements in data visualization software
Stay informed about new features and advancements in data visualization software to leverage the latest tools and techniques for financial analysis.
Conclusion
In conclusion, visualizing financial data using data visualization software is crucial for gaining insights, making informed decisions, and driving business growth. By simplifying complex financial information into intuitive visual formats, data visualization tools empower users to understand financial trends, identify patterns, and communicate findings effectively. It is essential for individuals and organizations in the financial sector to leverage data visualization software to unlock the full potential of their financial data and stay ahead in a data-centric world. Start visualizing your financial data today and unlock valuable insights for better decision-making and strategic planning.
Read about our post on fintech and financial literacy: empowering individuals with financial knowledge here.
Signup now for Free and enjoy unlimited Quotations & Invoices at www.blog.groflex.in


